
Niche analysis
Build a niche from Steam tags and compare it with the whole catalogue: the chance of a hit, the risk of going unnoticed, what a typical paid game earns and how fast new games arrive. Use it to decide whether to go into a niche or move to a neighbouring one.
Open Niche analysis →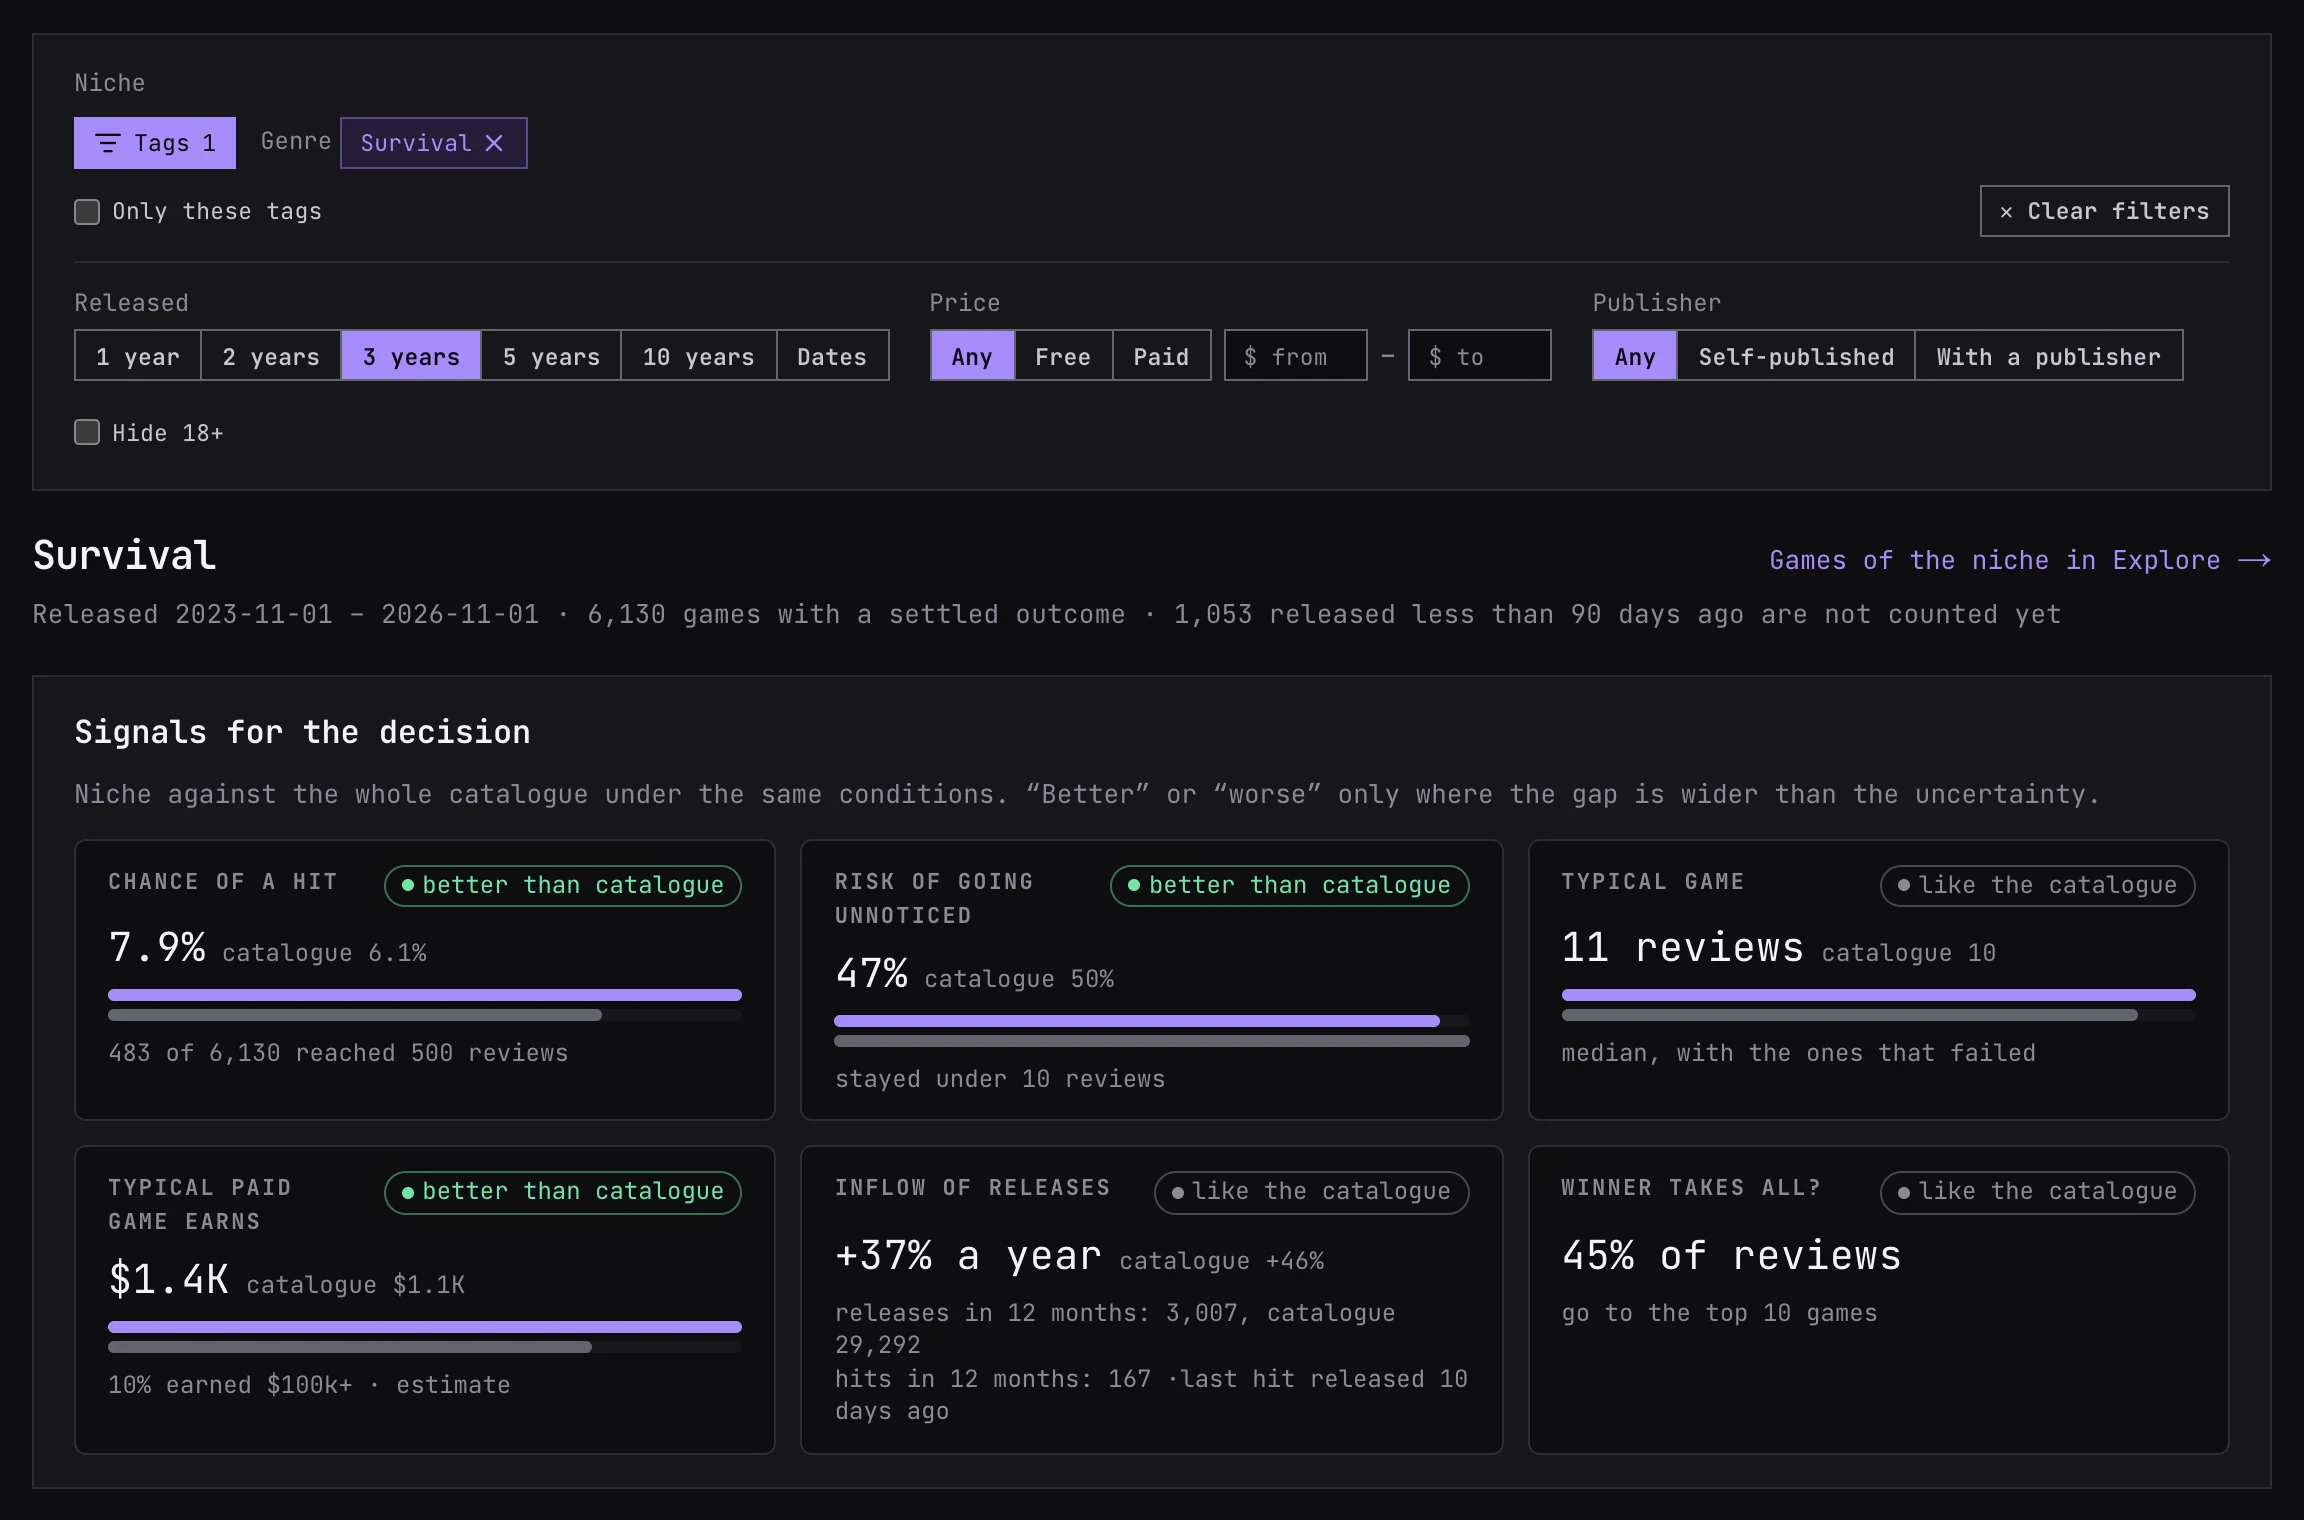
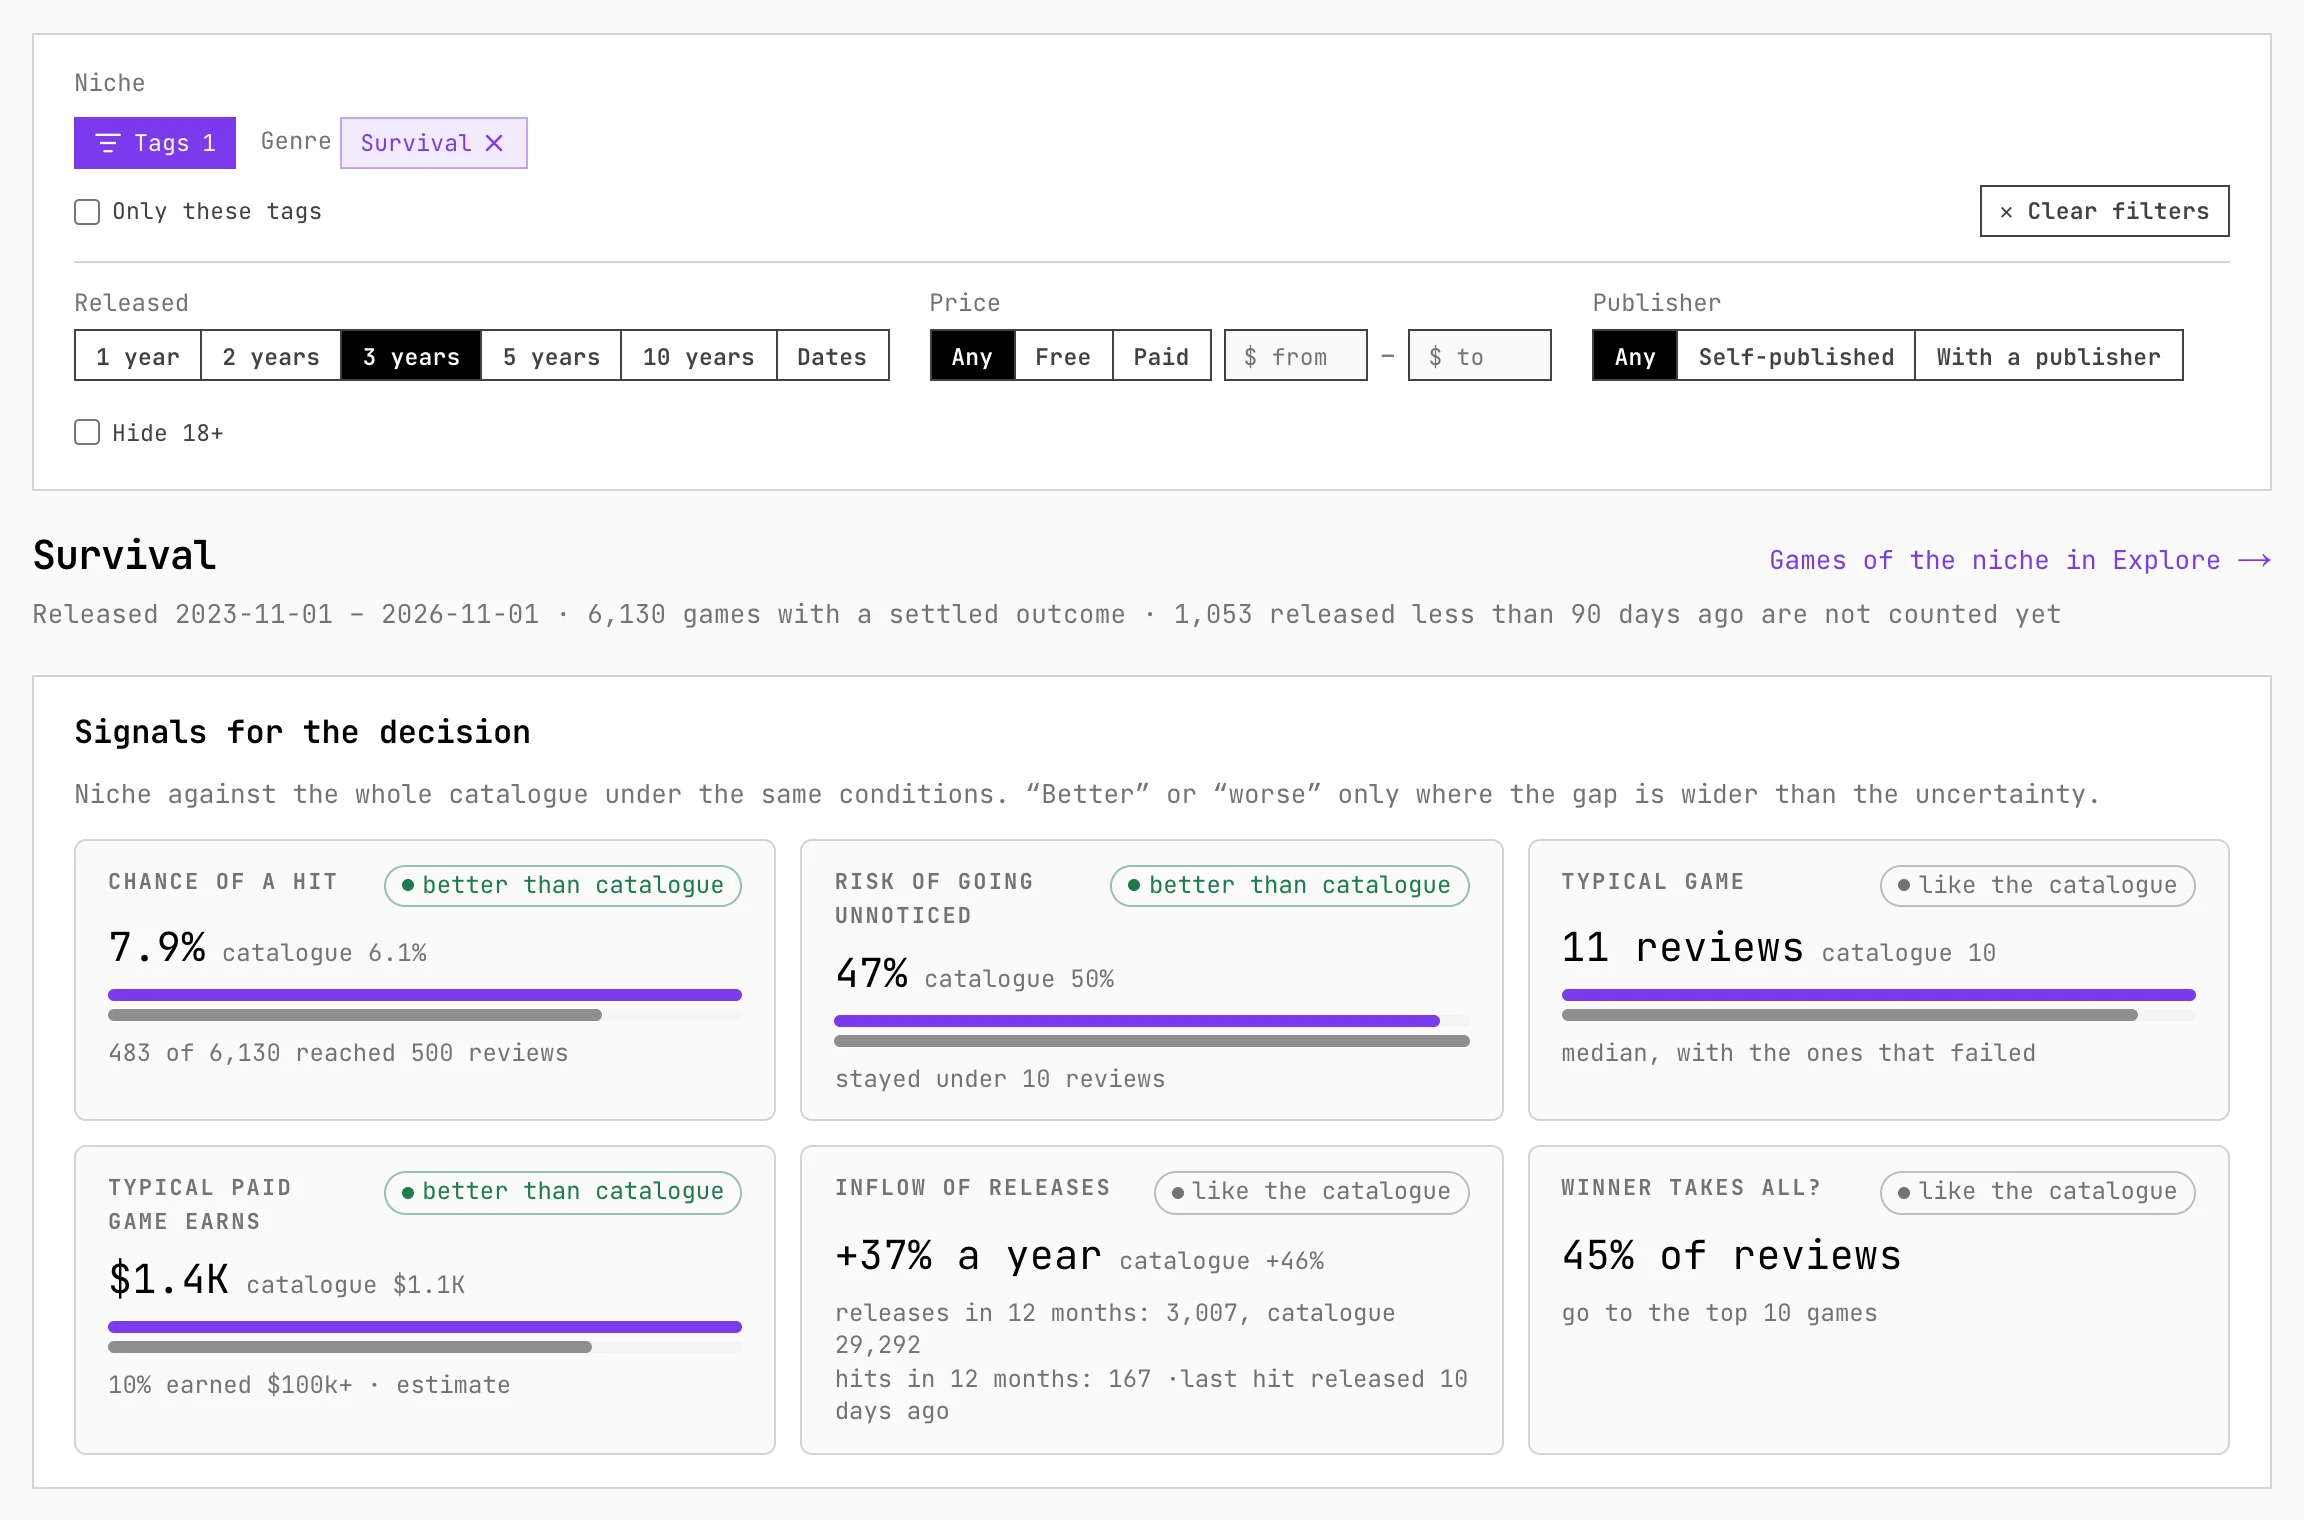
- Build a niche. Tags from different groups must all match; inside one group any of them is enough, or switch the group to all. A tag includes the narrower tags under it unless you tick Only these tags. With no tags the page offers ready combinations, and About this combination warns when one tag already implies another.
- Filters. Released in the last 1, 2, 3 (the default), 5 or 10 years or between your own dates; price: any, free, or paid with a range; publisher: any, self-published or with a publisher; Hide 18+. The link keeps them, and a posted link opens with a preview image of the niche.
- Which games count. A game is placed by the start of sales; for Early Access, by its first reviews when they came well before 1.0. Only games on sale for 90 days or more are judged. With fewer than 20 of them the shares are hidden and the page suggests widening the niche.
Signals for the decision
Six cards, each next to the catalogue under the same filters without tags. A card says better or worse only when the gap is wider than the uncertainty of the number.
- Chance of a hit — the share of games that reached 500 reviews.
- Risk of going unnoticed — the share that stayed under 10 reviews.
- Typical game — the median of reviews, failures included.
- Typical paid game earns — the median estimated revenue of paid games and the share that made $100k or more. Shown from 20 paid games.
- Inflow of releases — releases in the last 12 months against the 12 before, next to the catalogue’s growth, with the hits of the last year. Shown when the earlier year had 10 or more releases; it ignores the Released filter.
- Winner takes all? — the share of all reviews held by the top 10 games. 70% or more means a few games take most of the attention, 40% or less that it is spread out.
The rest of the page
- What happens to a game here — the share of games that reached 1, 10, 50, 100, 500, 1,000, 5,000 and 10,000 reviews, niche against catalogue.
- Self-published or with a publisher, Which price works — the chance of a hit and the median for each side, and for each price band from free and under $5 to $30 and more.
- How the niche changed — releases and the chance of a hit year by year since 2017, with the announced games and how many of them have 1,000 followers or more.
- Leaders — the top games of the window, the breakouts of the last 12 months and the most followed announced games.
- Age cohorts — median reviews after 3, 6, 12 and 24 months on sale, by the year sales started, coloured against the catalogue. This block loads last.
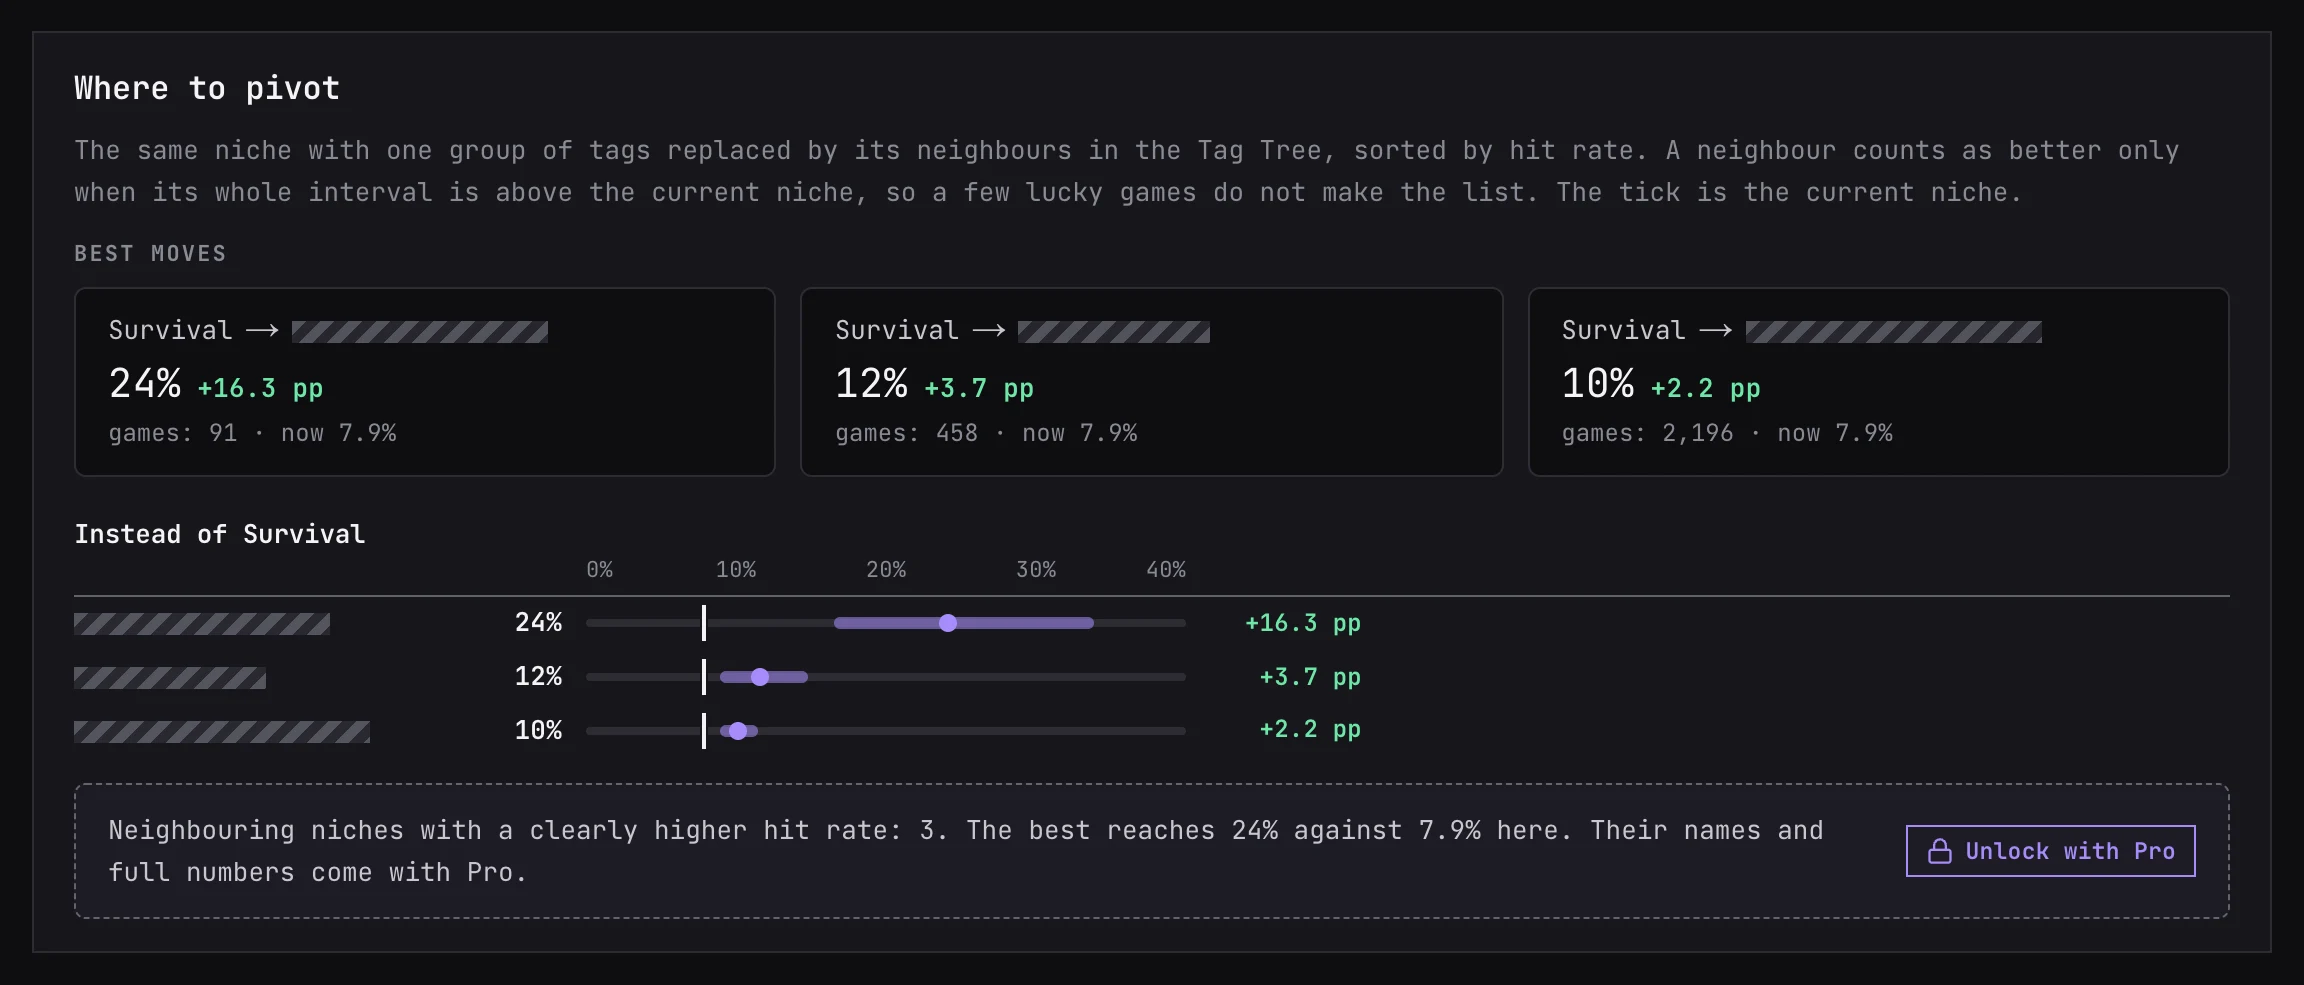
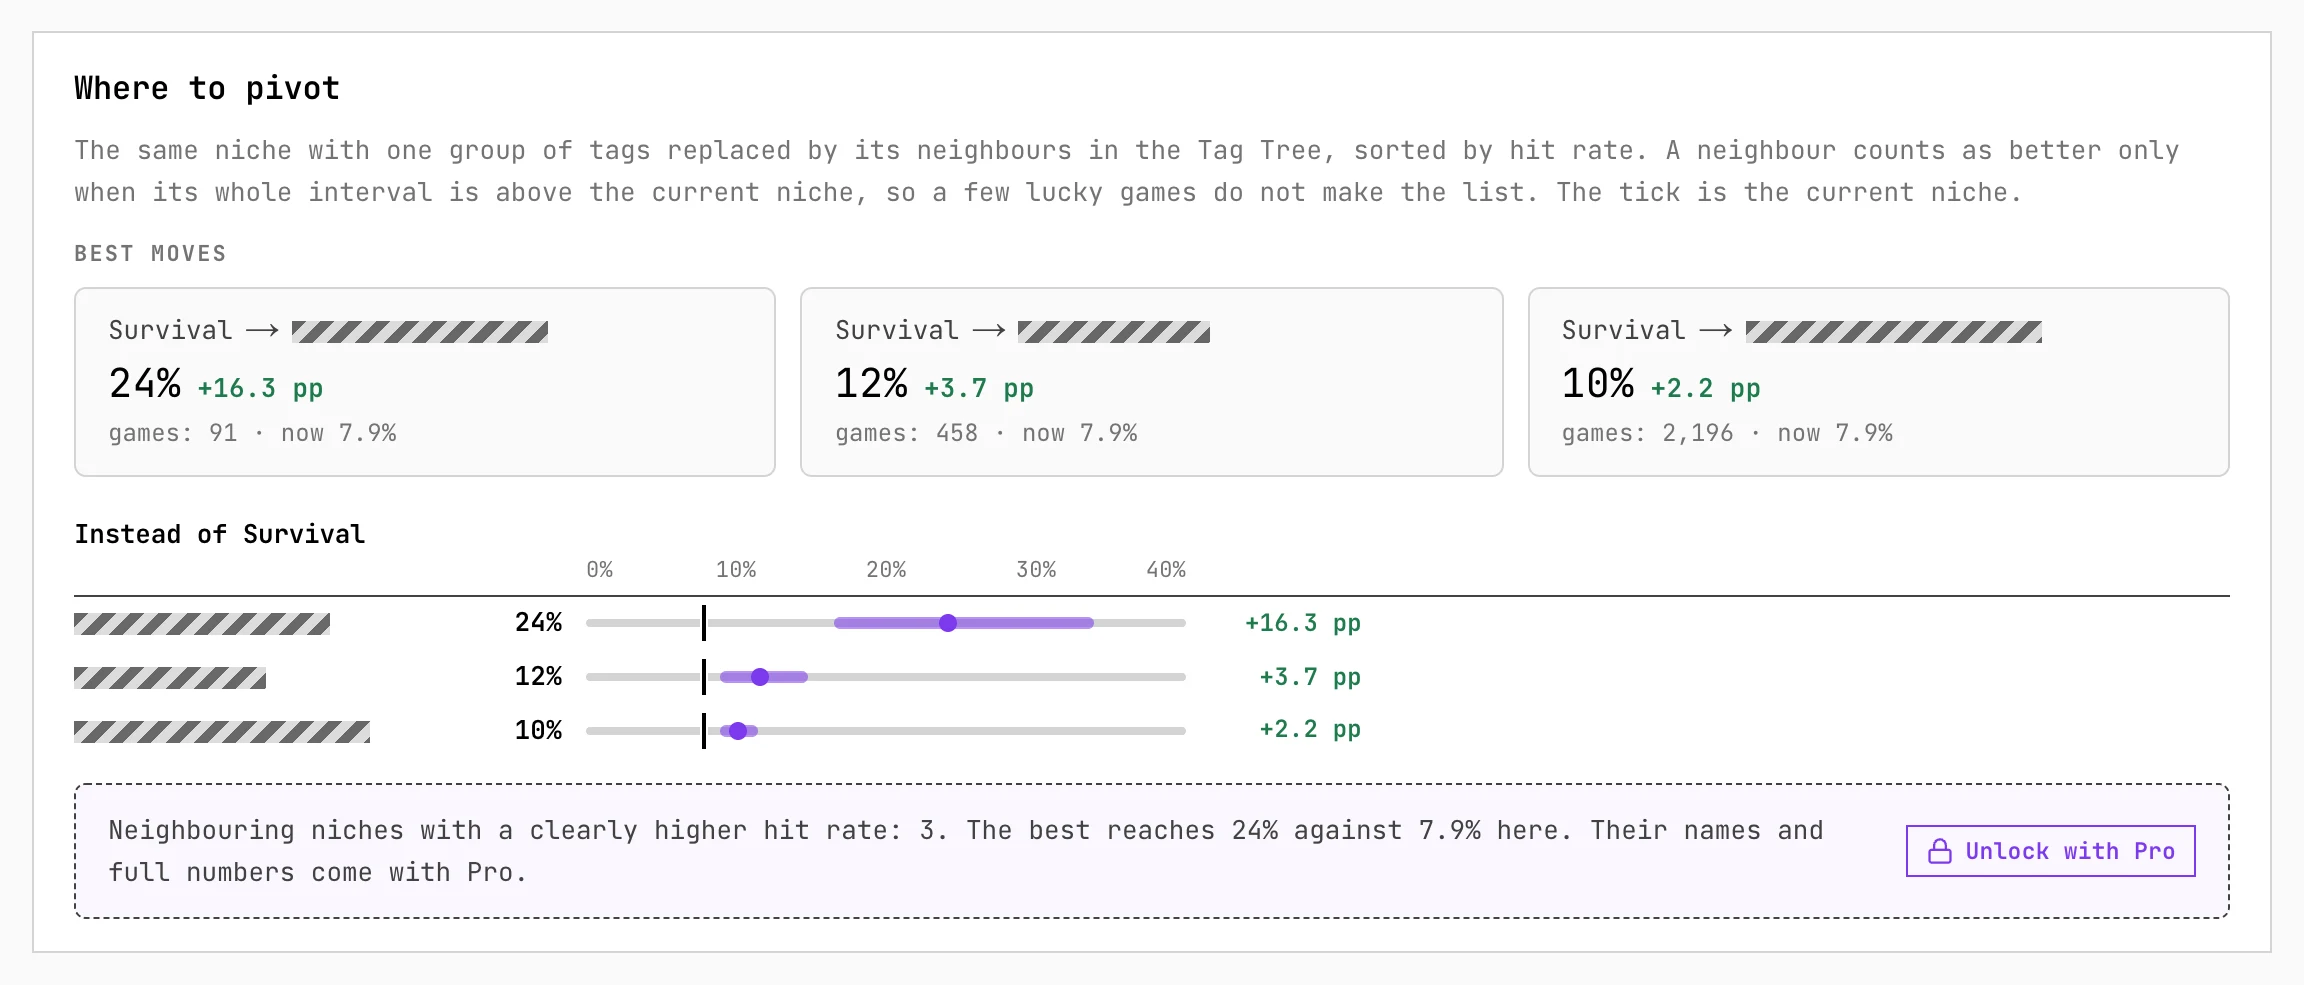
- Where to pivot (Pro) — the same niche with one group of tags swapped for its neighbours in the Tag Tree, the broader tag above it, or dropped, ranked by chance of a hit. Best moves are the ones clearly better than the current niche. Click one to open it.
- What sets hits apart (Pro) — tags that hits carry more or less often than the rest of the niche. Click a tag to narrow the niche to it.
- Without Pro these two blocks show their numbers with the names hidden; Unlock with Pro opens the plans.
- Niche of the day on Home: a new combination every day where hits are clearly more common than in the catalogue, with four of its signals. Open the analysis opens it here.
Worth knowing
- A hit is 500 reviews or more over the game’s life; unnoticed is under 10. Shares come with a 95% interval, so a small niche can look different from the catalogue and still be marked as like the catalogue.
- Revenue is our estimate from reviews and the price players actually paid in the US, after Steam’s cut, refunds and taxes. It is not Steam’s figure.
- What sets hits apart is a correlation: a tag that hits carry more often is not a recipe.
- Tag Tree opens a page per tag: one tag over a fixed window, with its pairings and best known games. Niche analysis combines several tags and filters and sets them against the catalogue.