Market trends
The market as a whole: how fast Steam’s release volume grows, which niches are getting crowded and which draw interest, which tags rise or fade, and what happens to the studios that ship.
Open Market trends →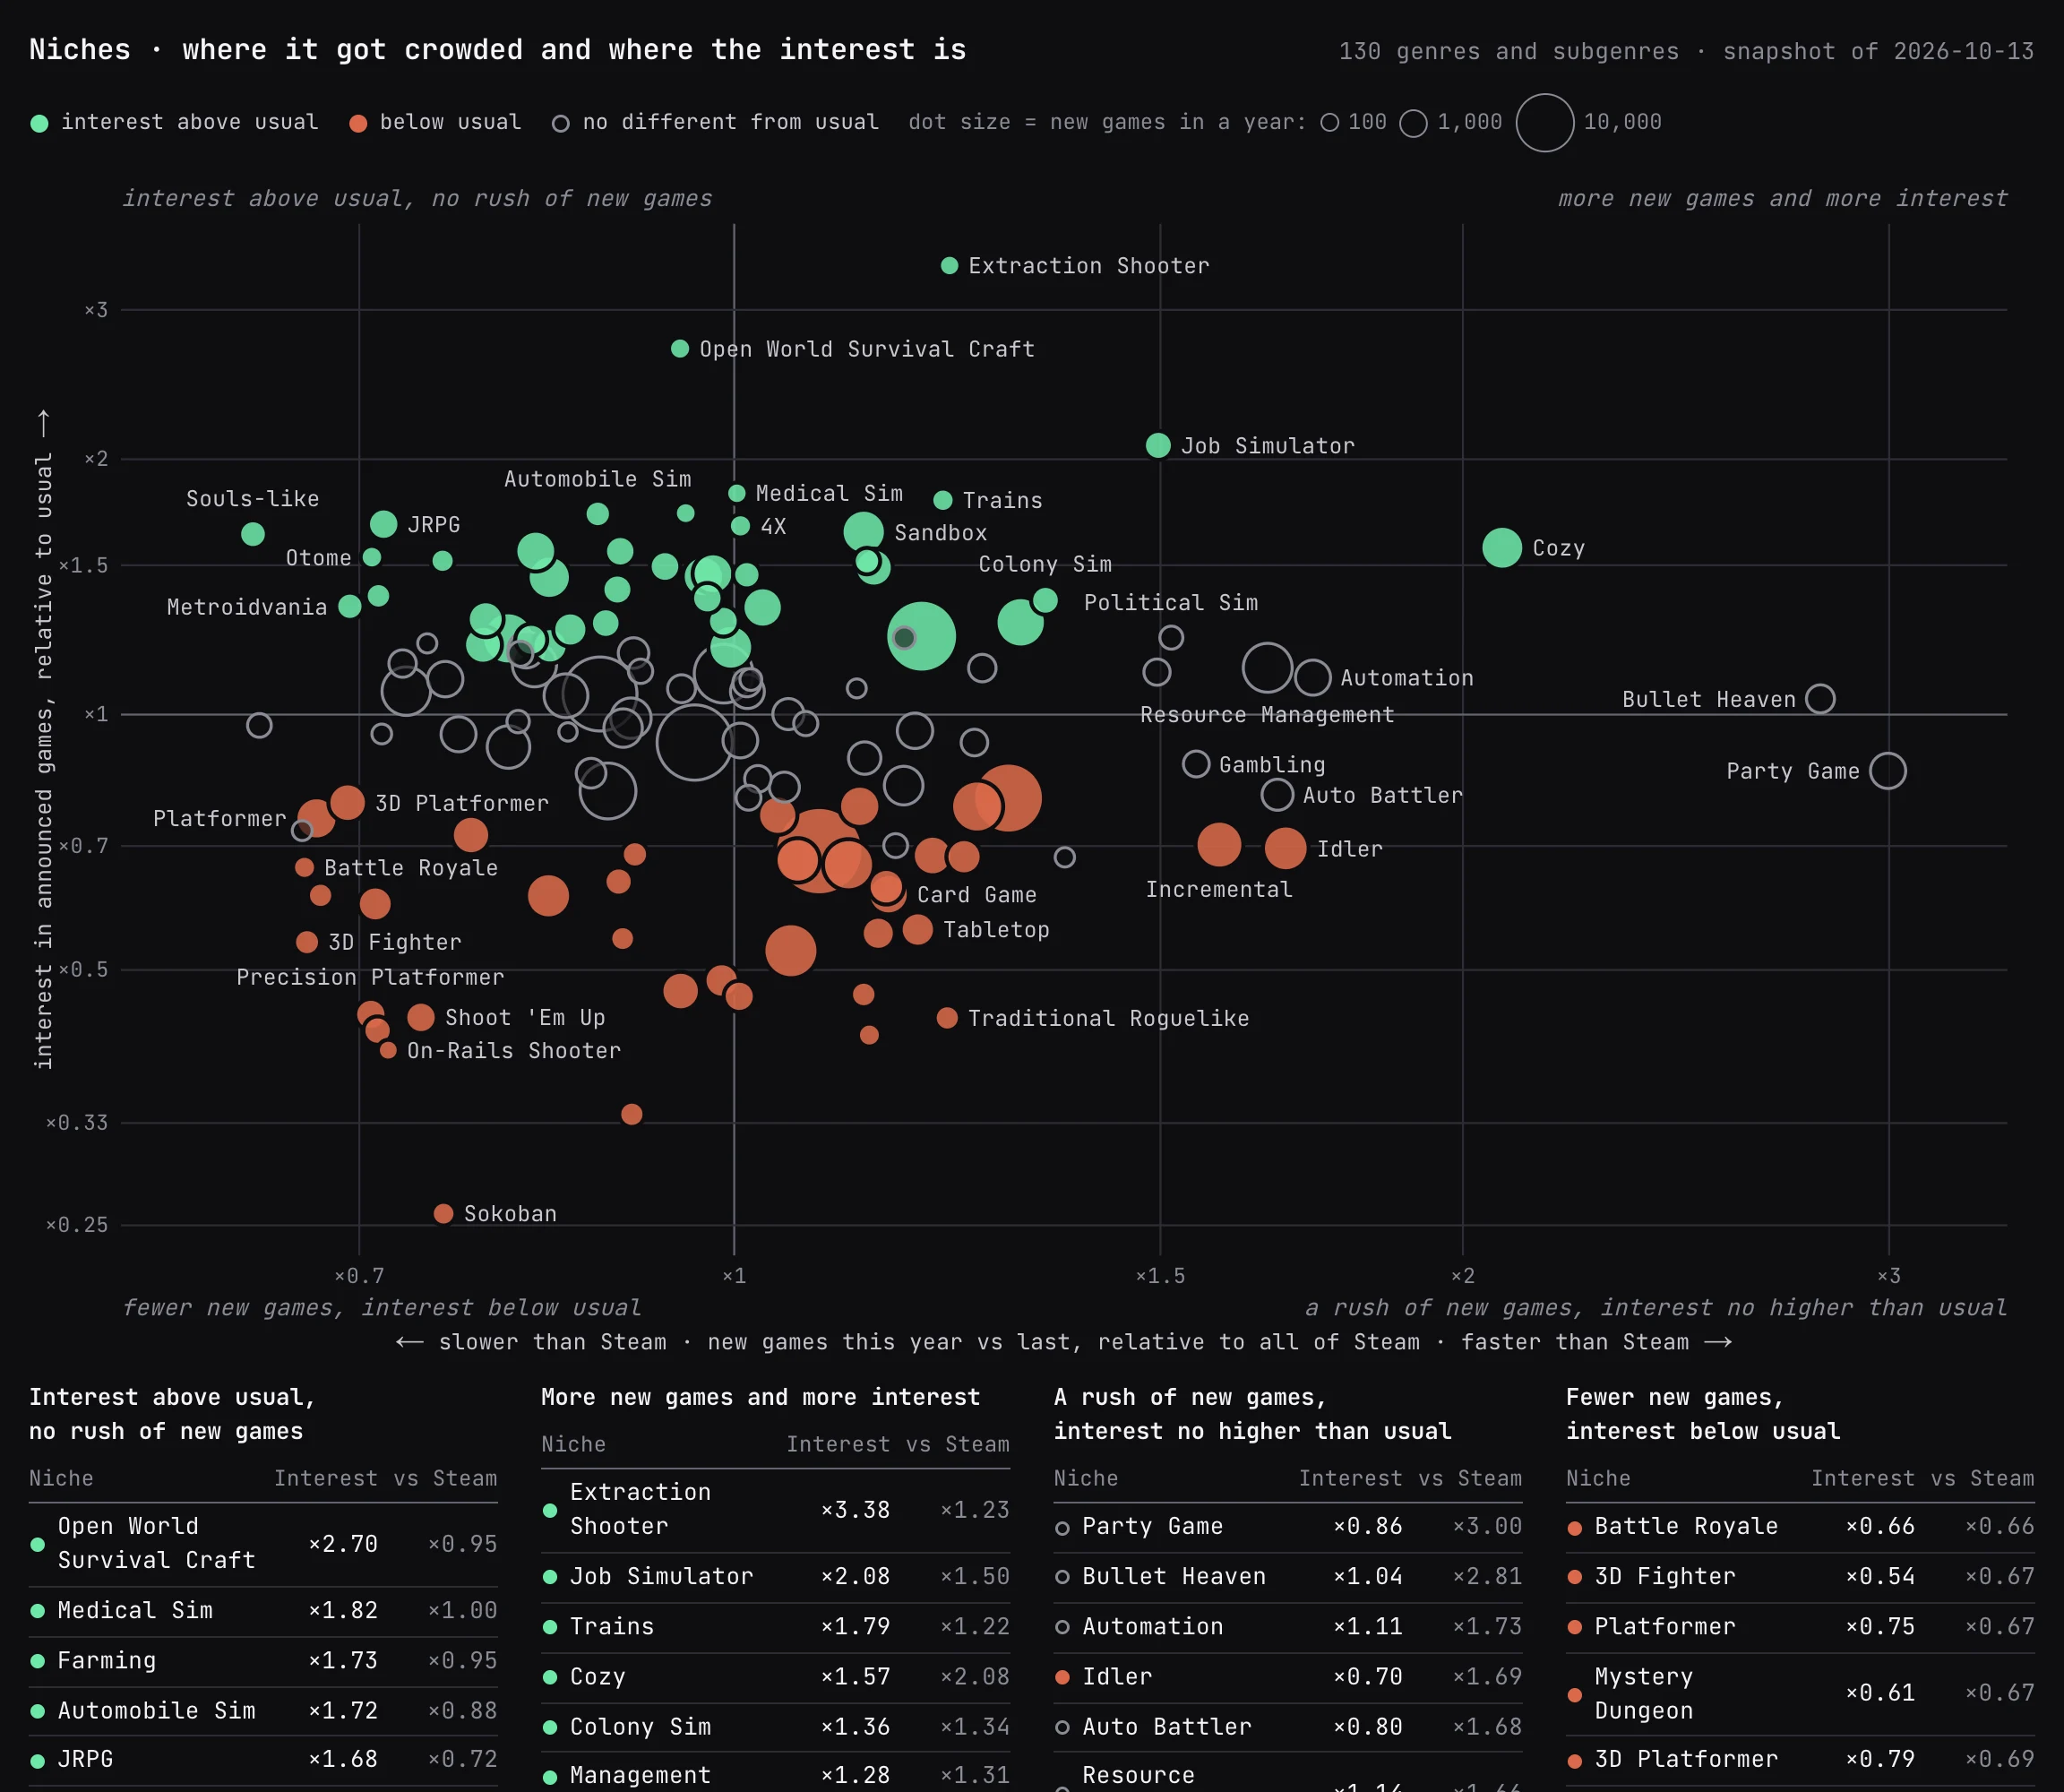
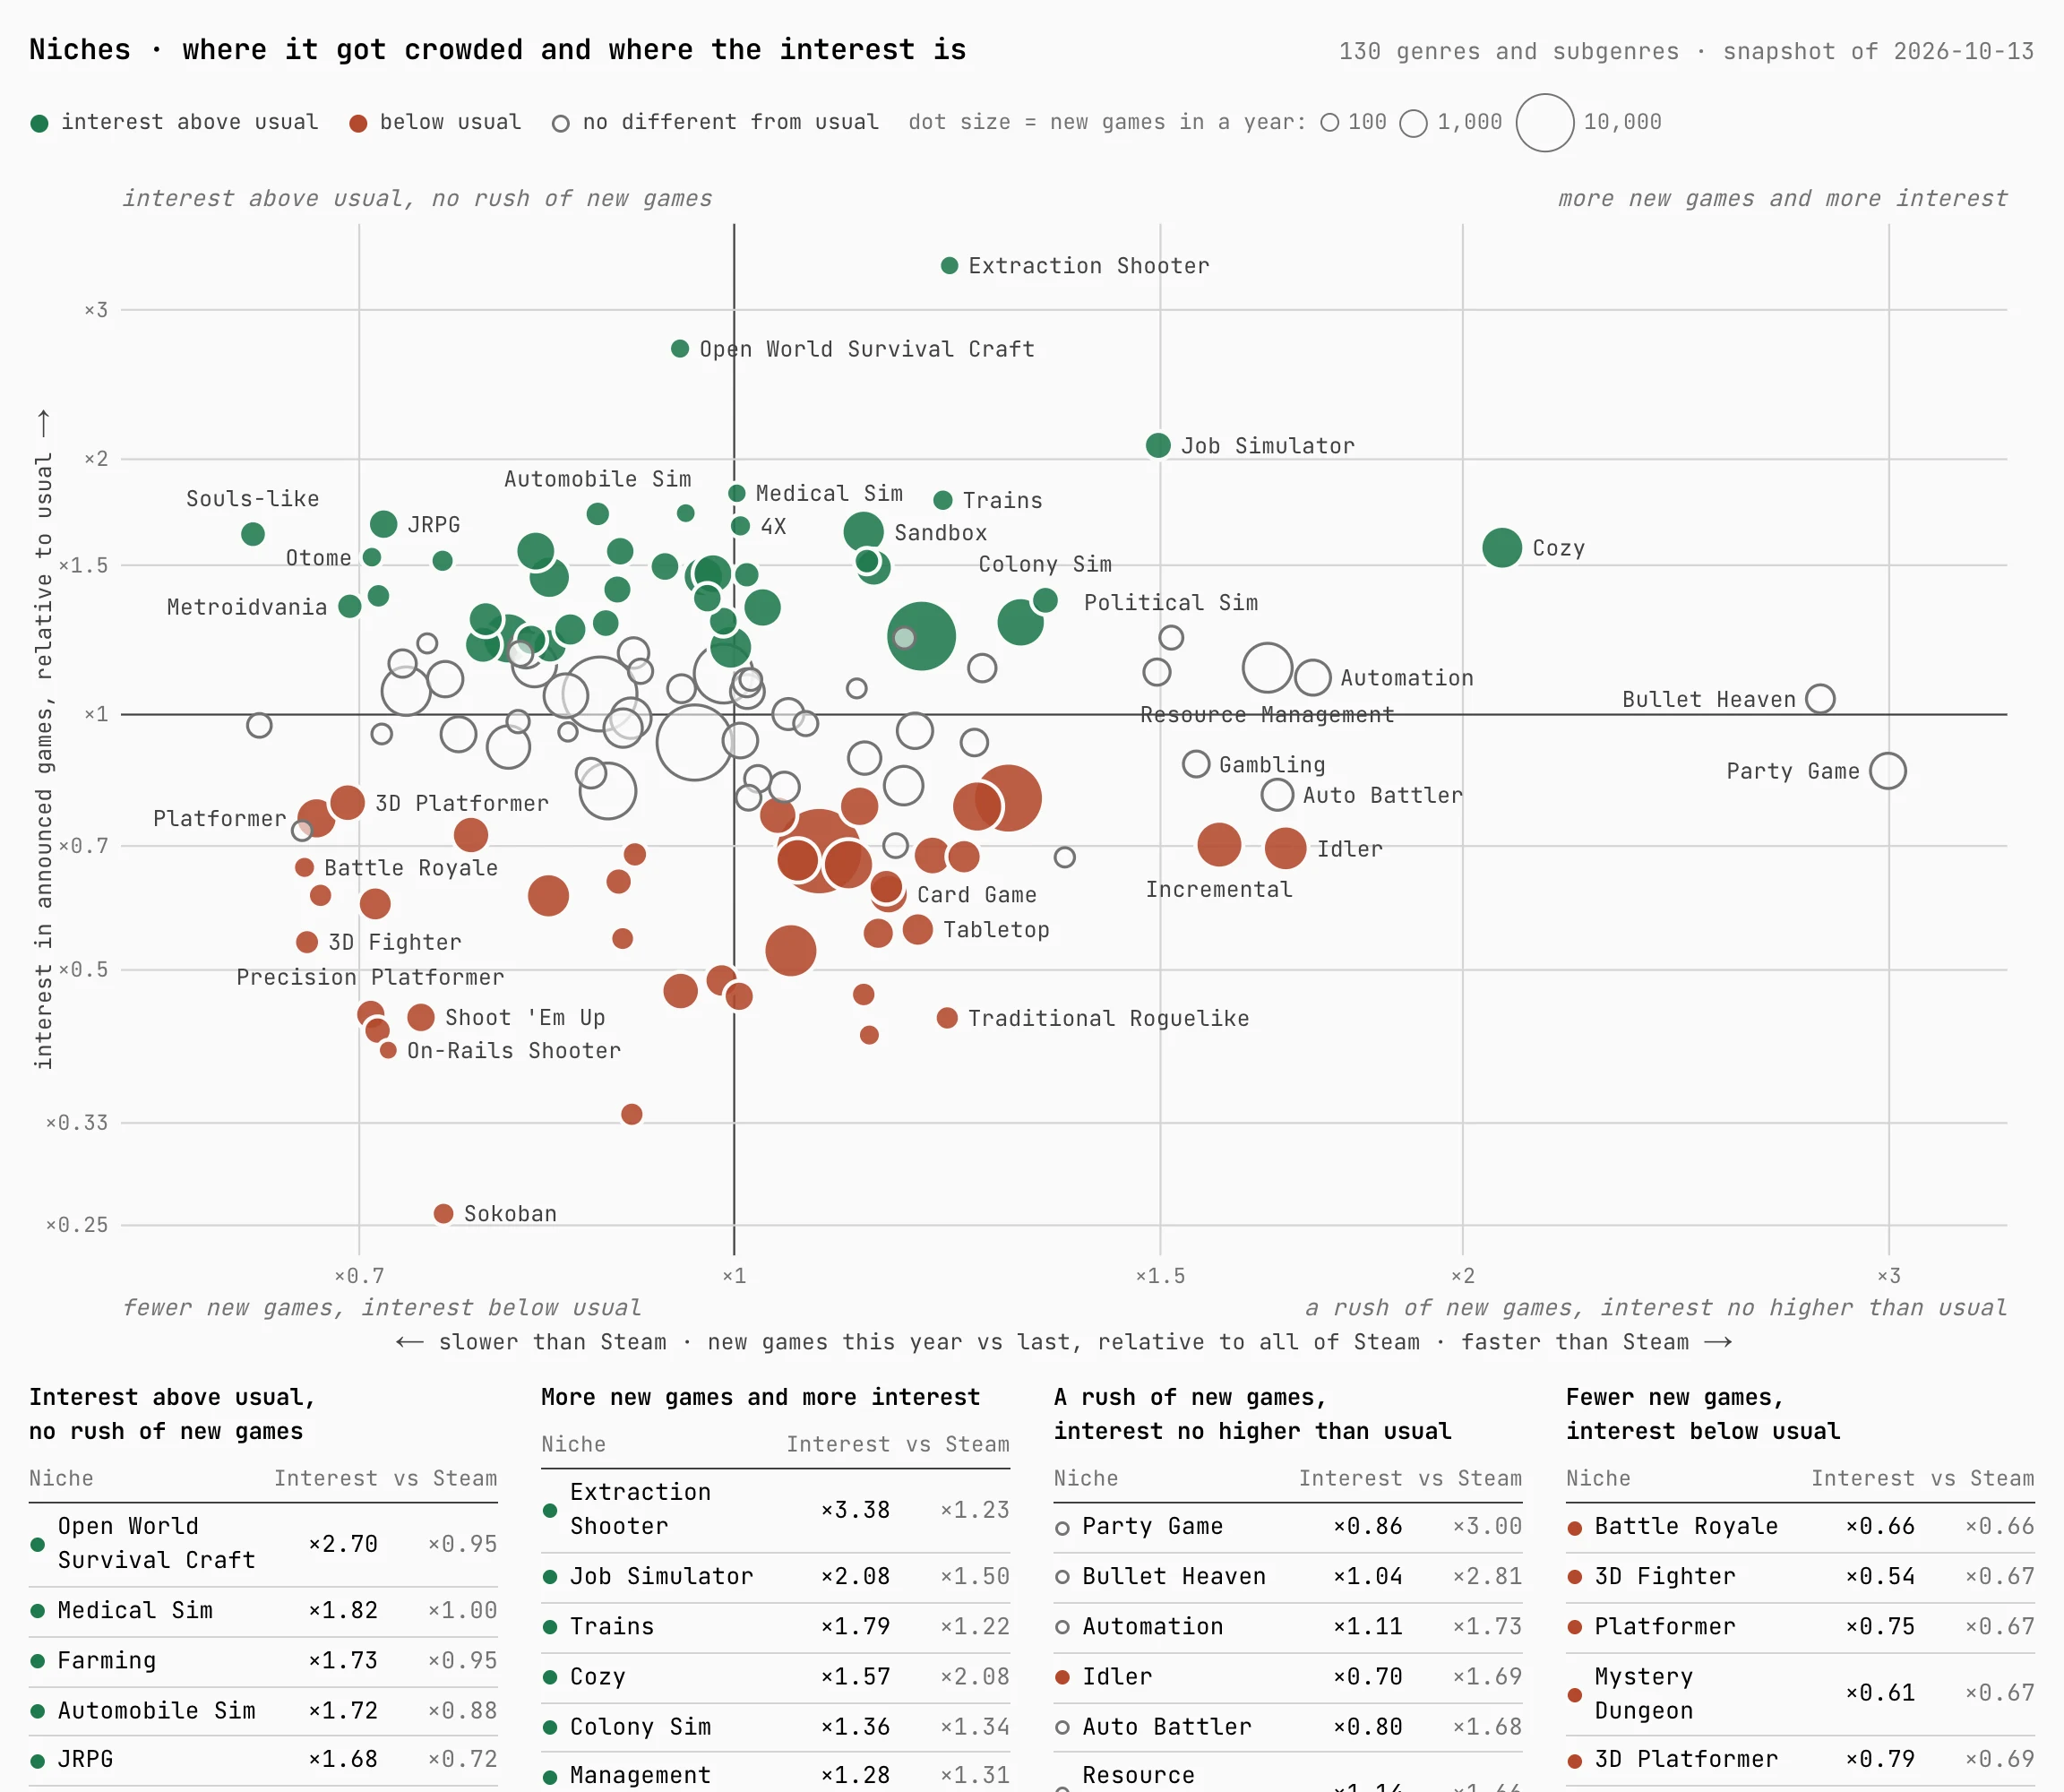
- Niche map — every genre and subgenre as a dot: how much faster than Steam as a whole it adds new games this year, and how much interest its announced games draw compared with usual. The corners list the niches that stand out most each way. It is a snapshot, not a forecast; a hollow dot means the gap is within noise.
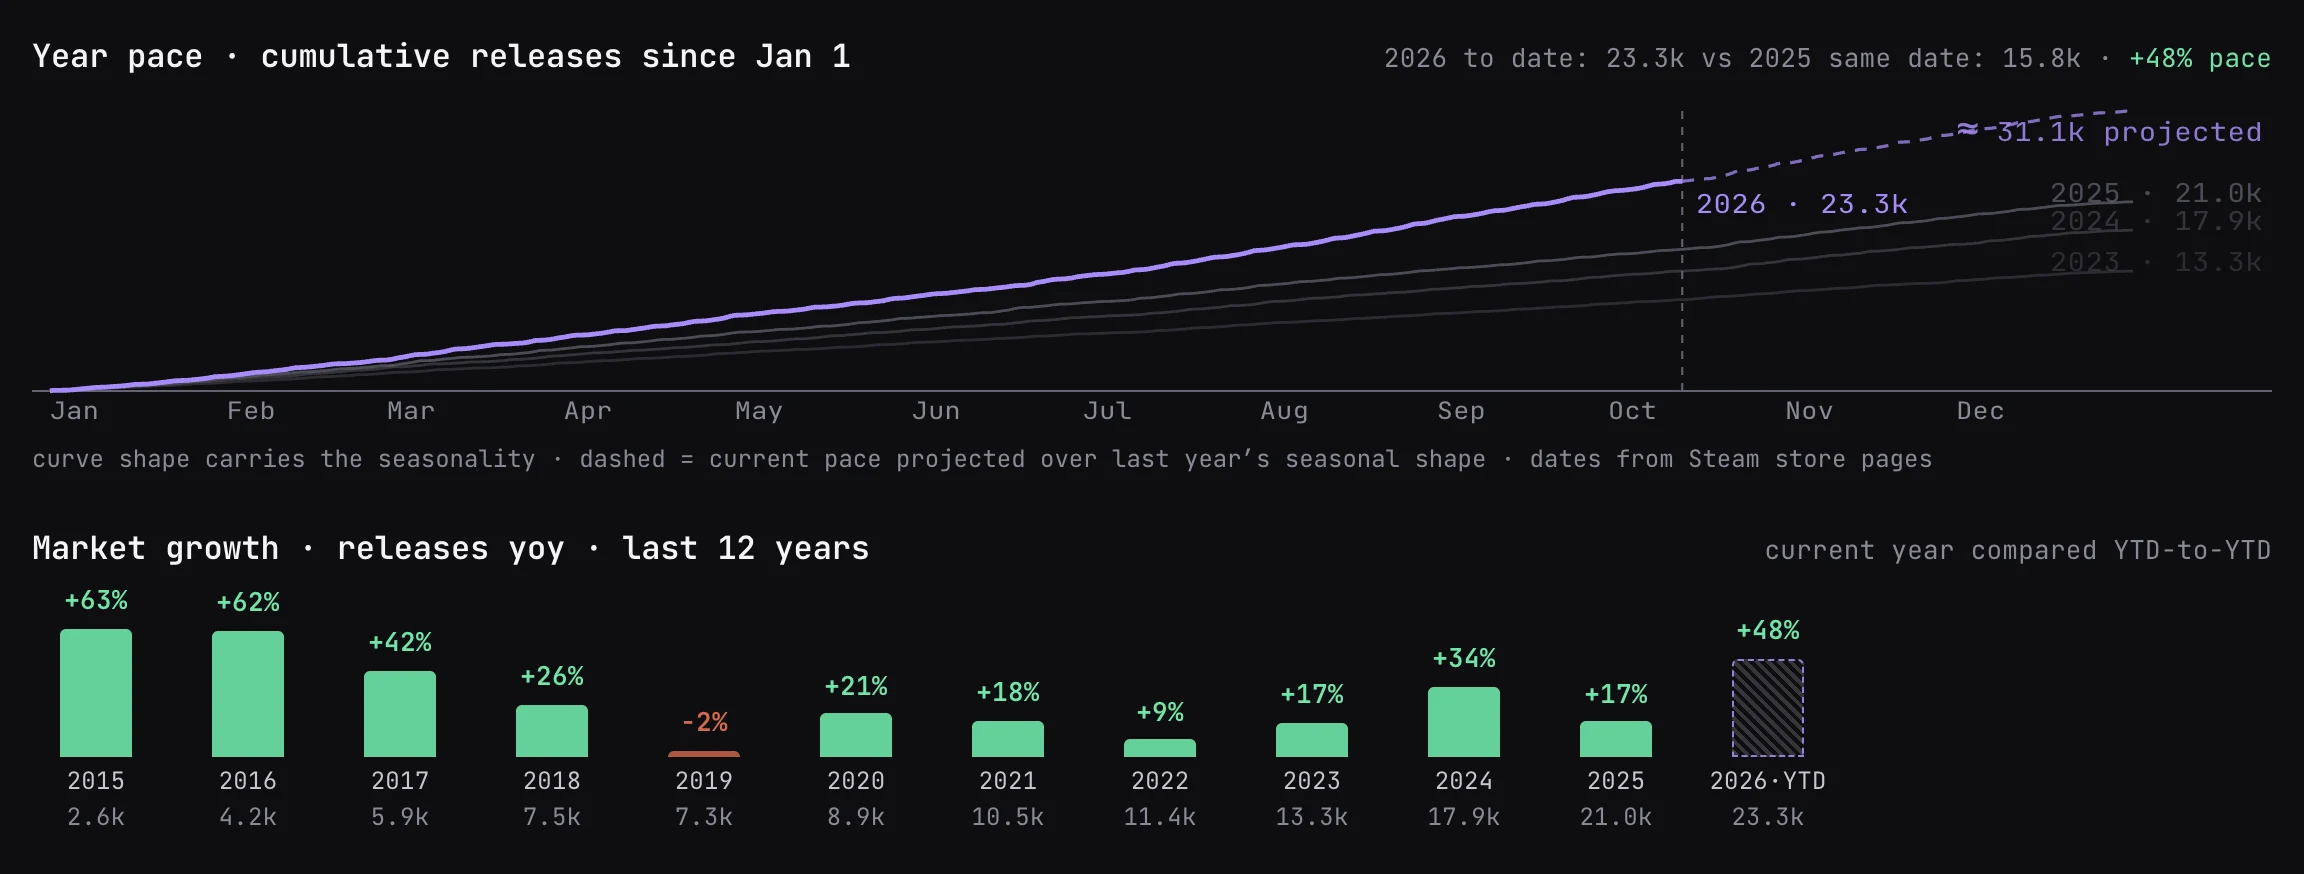
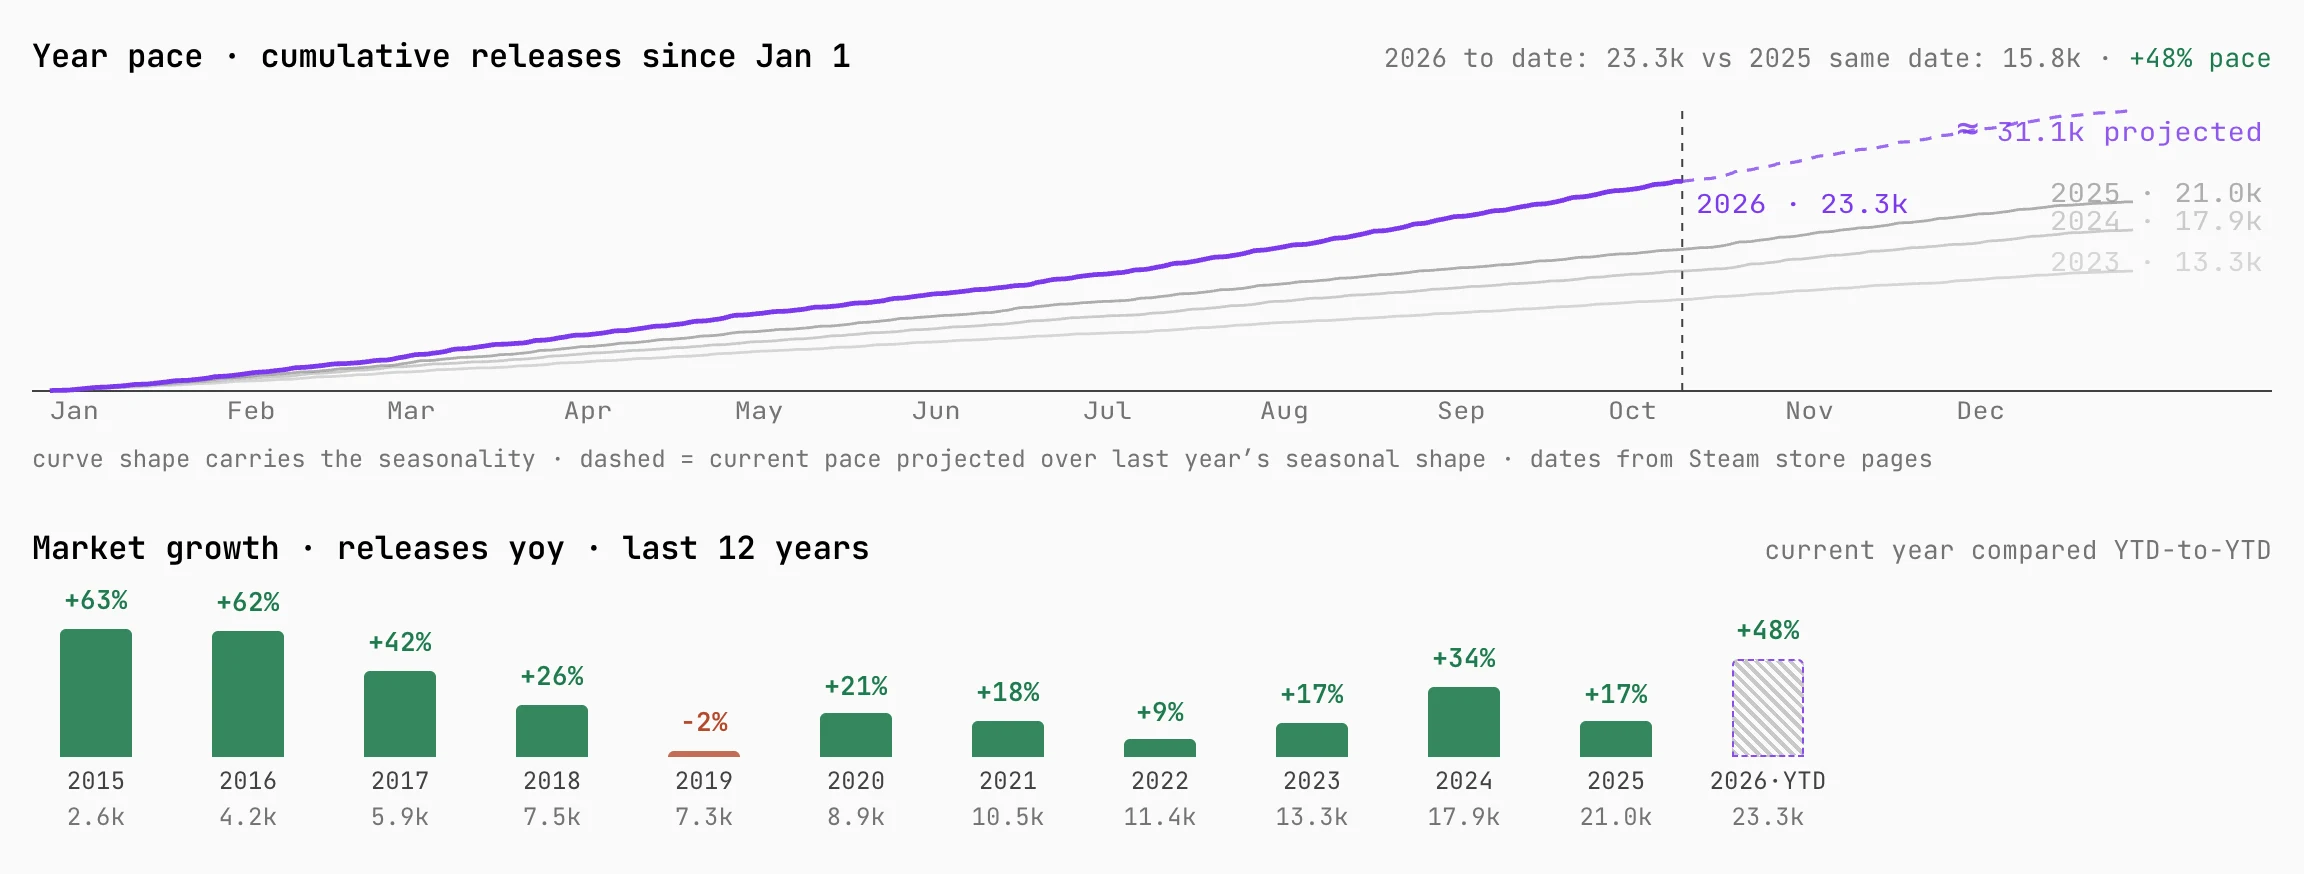
- Year pace — releases since January 1 against the same date in the three years before; the dashed line carries the current pace over last year’s seasonal shape. Below it: releases per year with the yearly change, and the weekday and month patterns.
- Steam users per release — yearly peak online users divided by dated releases: one line that shows how competition tightened.
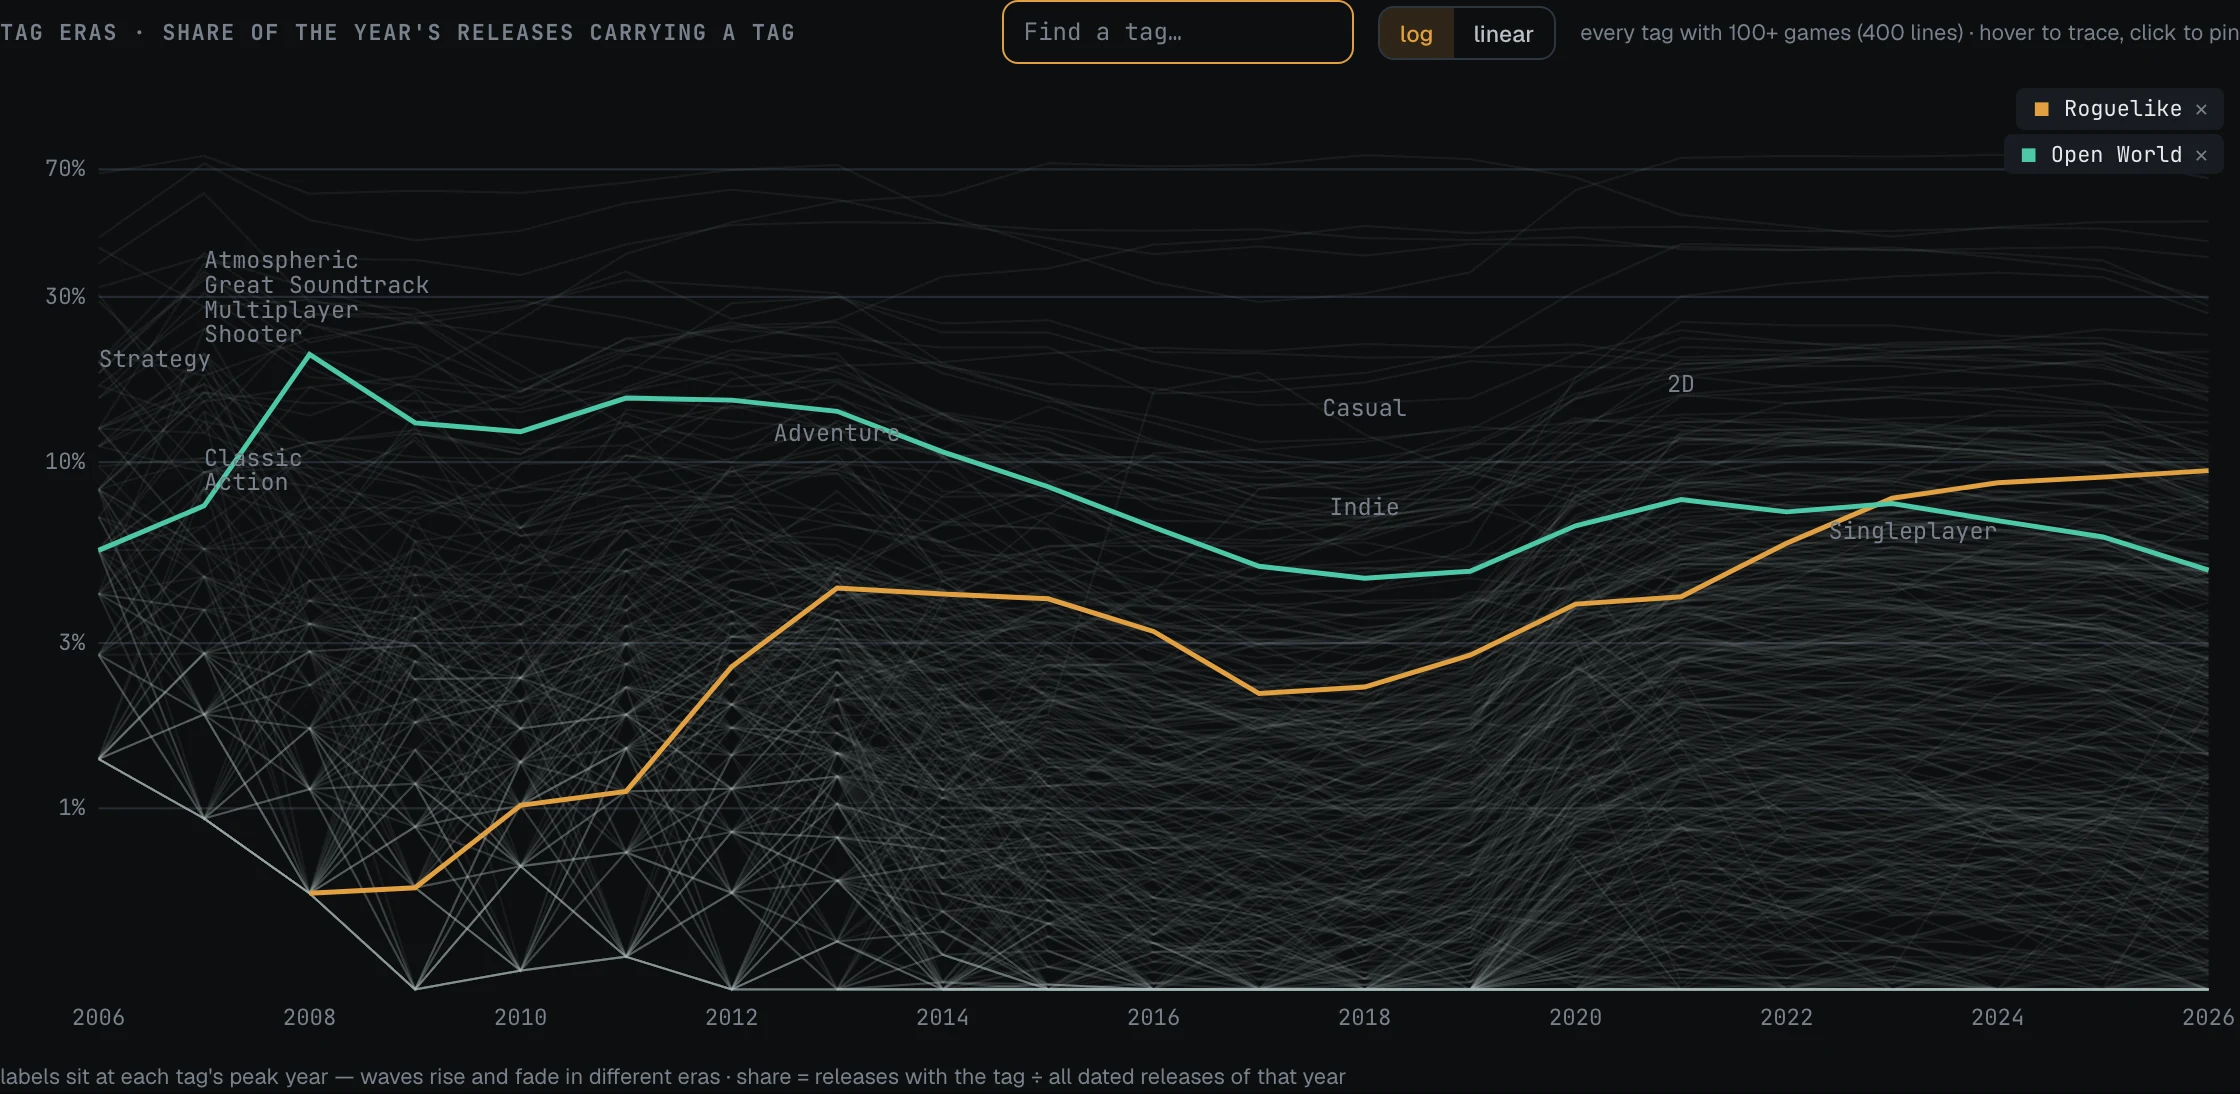
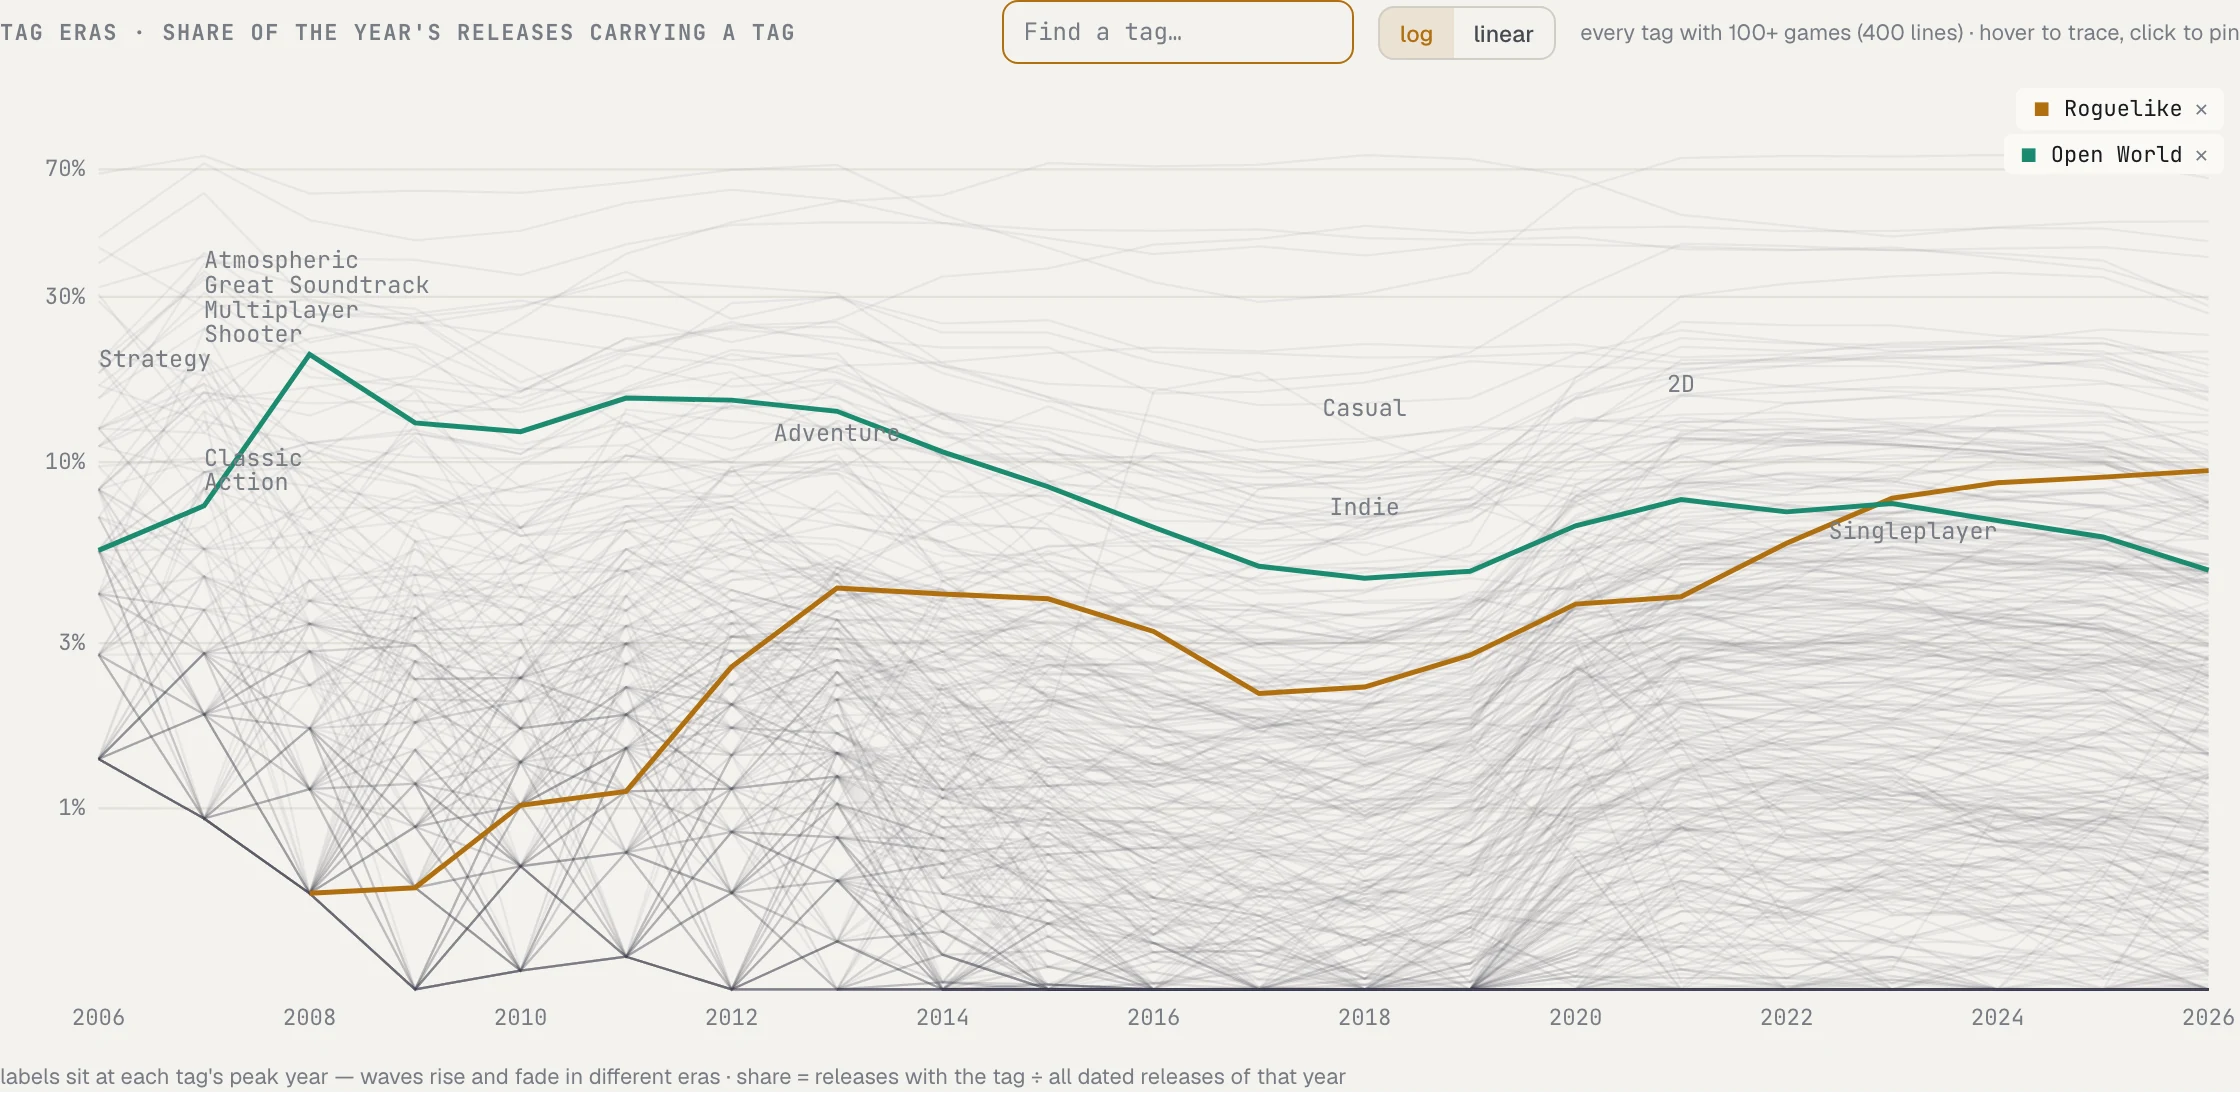
- Tag eras — every tag with 100+ games as one line. The log scale, on by default, keeps small tags readable; labels sit at each tag’s peak year.
- Filter by tag to count the pace, the growth and the weekday and month charts for your own niche: tags in one group combine with or, groups with and. The niche map circles a single chosen tag; users per release, tag eras and studios always show the whole store.
- Share builds an image from the niche map, the fastest-growing tags and the year pace, in feed or wide format, light or dark, with a post text whose numbers match the image.
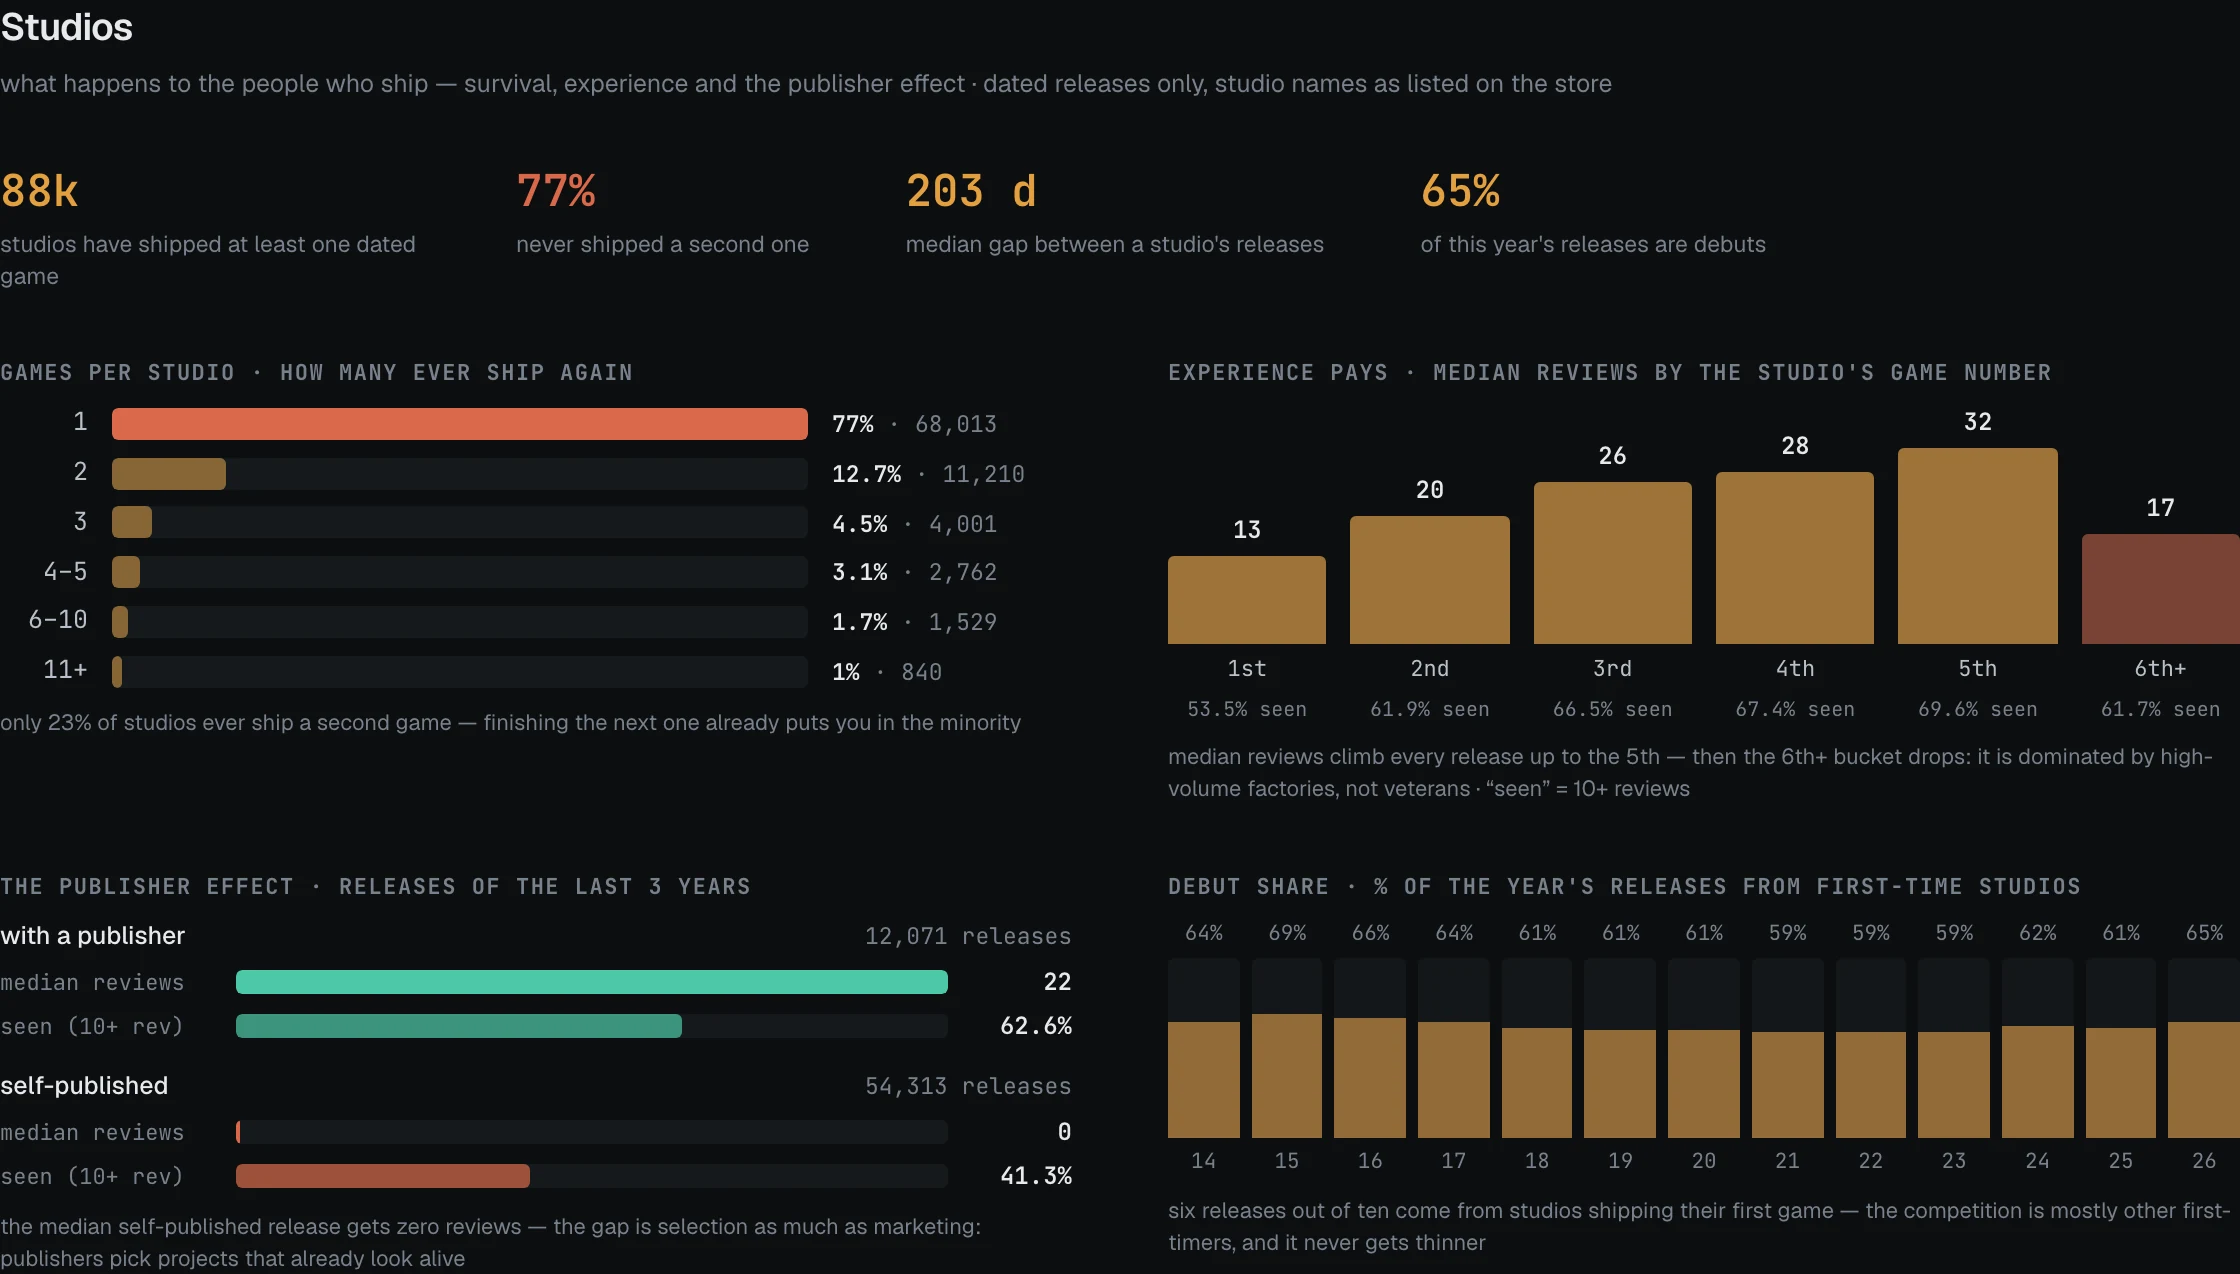
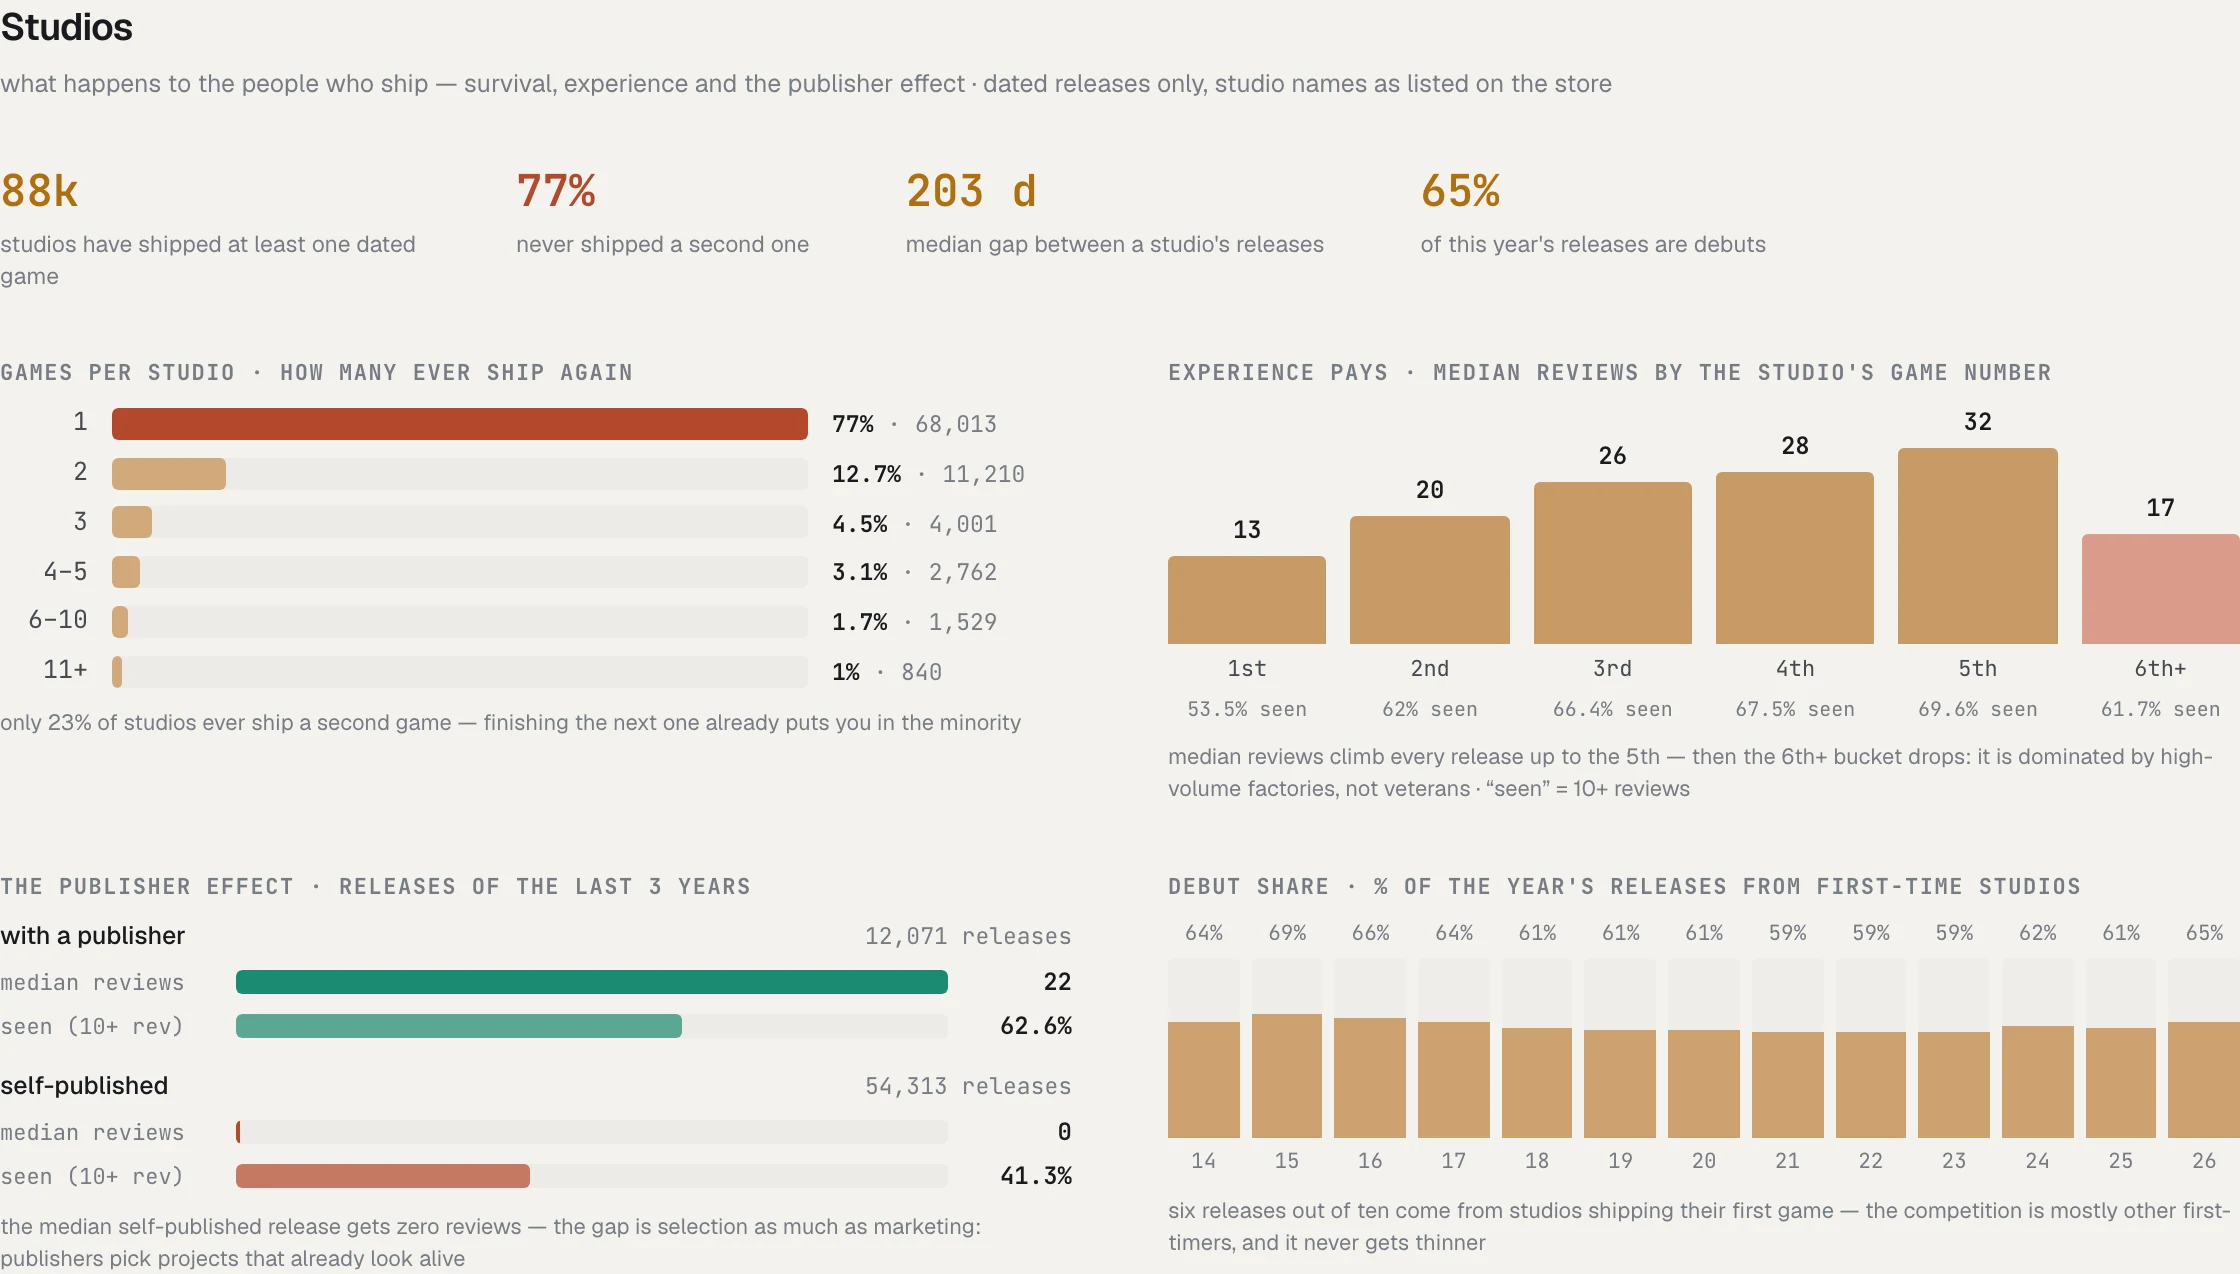
Studios
What happens to the people who ship: how many studios ever release a second game, whether experience pays, and what a publisher changes.